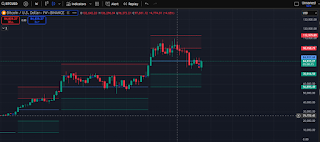
Bitcoin (BTC) is showing strong signs on the weekly chart, holding above key support zones while facing resistance around $88,700.
This could be the calm before a major breakout.
🔹 Current Market Overview:
-
Price: ~$84,800
-
Key Resistance: $88,700
-
Major Supports: $70,900 and $56,800
-
Target After Breakout: $100,000 – $112,000
Chart Insights:
The weekly chart shows that BTC is still in a strong uptrend. Price is forming higher lows, which is a bullish sign.
(Source Trading View)
The current range is tight, but pressure is building just below $88.7k resistance. If this level breaks with volume, BTC could rally fast toward new all-time highs.
The support zone at $70k has held well during pullbacks.
This confirms that buyers are still in control.
As long as BTC stays above $70k, the structure remains bullish.

Comments
Post a Comment